
And Finally: Equity Diversification
Part 3 of the Diversification Pillars series

The last piece of the diversification puzzle might be obvious. It has been highlighted in the following chart the whole time! Value stocks.
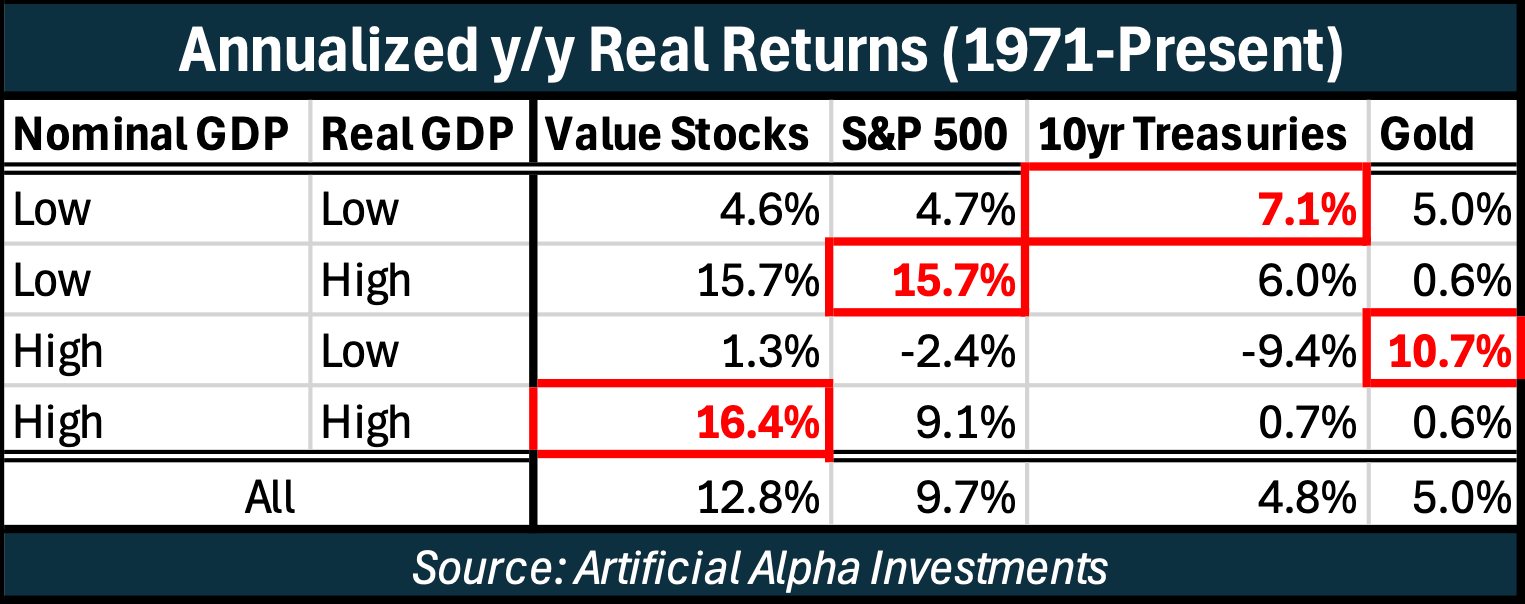
Not just Value stocks though. This chart uses Value stocks for its visualization but all economically sensitive equities fall into this bucket, including Small-caps and Mid-caps. Many companies have different economic drivers than Large-caps and their stocks benefit from inflationary environments.
We will again substantiate added diversification, this time amongst stocks, via the same backtests as before.
Reducing Volatility
The following statistics suggest that investors benefit from further equity diversification. The 30/30/20/20 portfolio includes 30% S&P 500, 15% Value stocks, 7.5% Small-caps, 7.5% Mid-caps, 20% Treasuries, and 20% Gold.
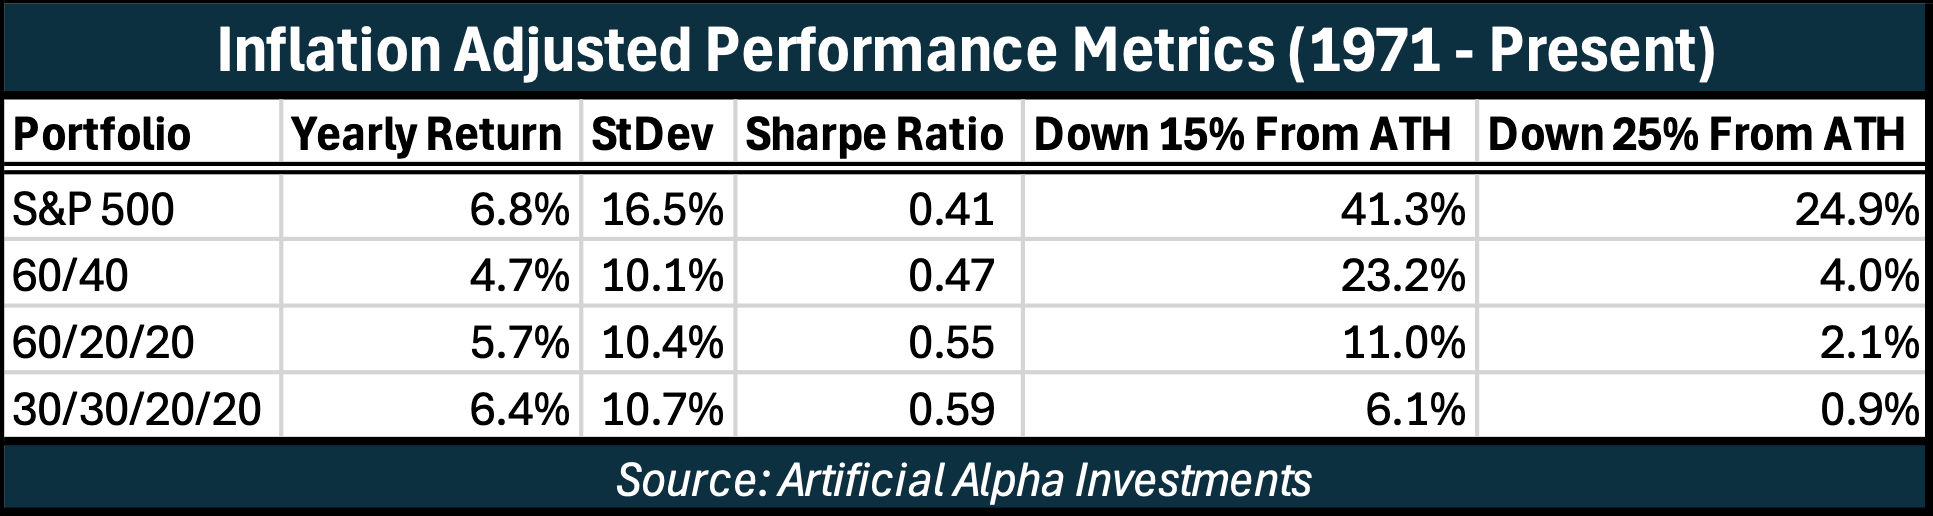
Volatility-adjusted returns were improved over all previous portfolios and large drawdowns were again less frequent.
The real performance of this final diversified portfolio is visualized vs. the initial S&P 500 portfolio below.
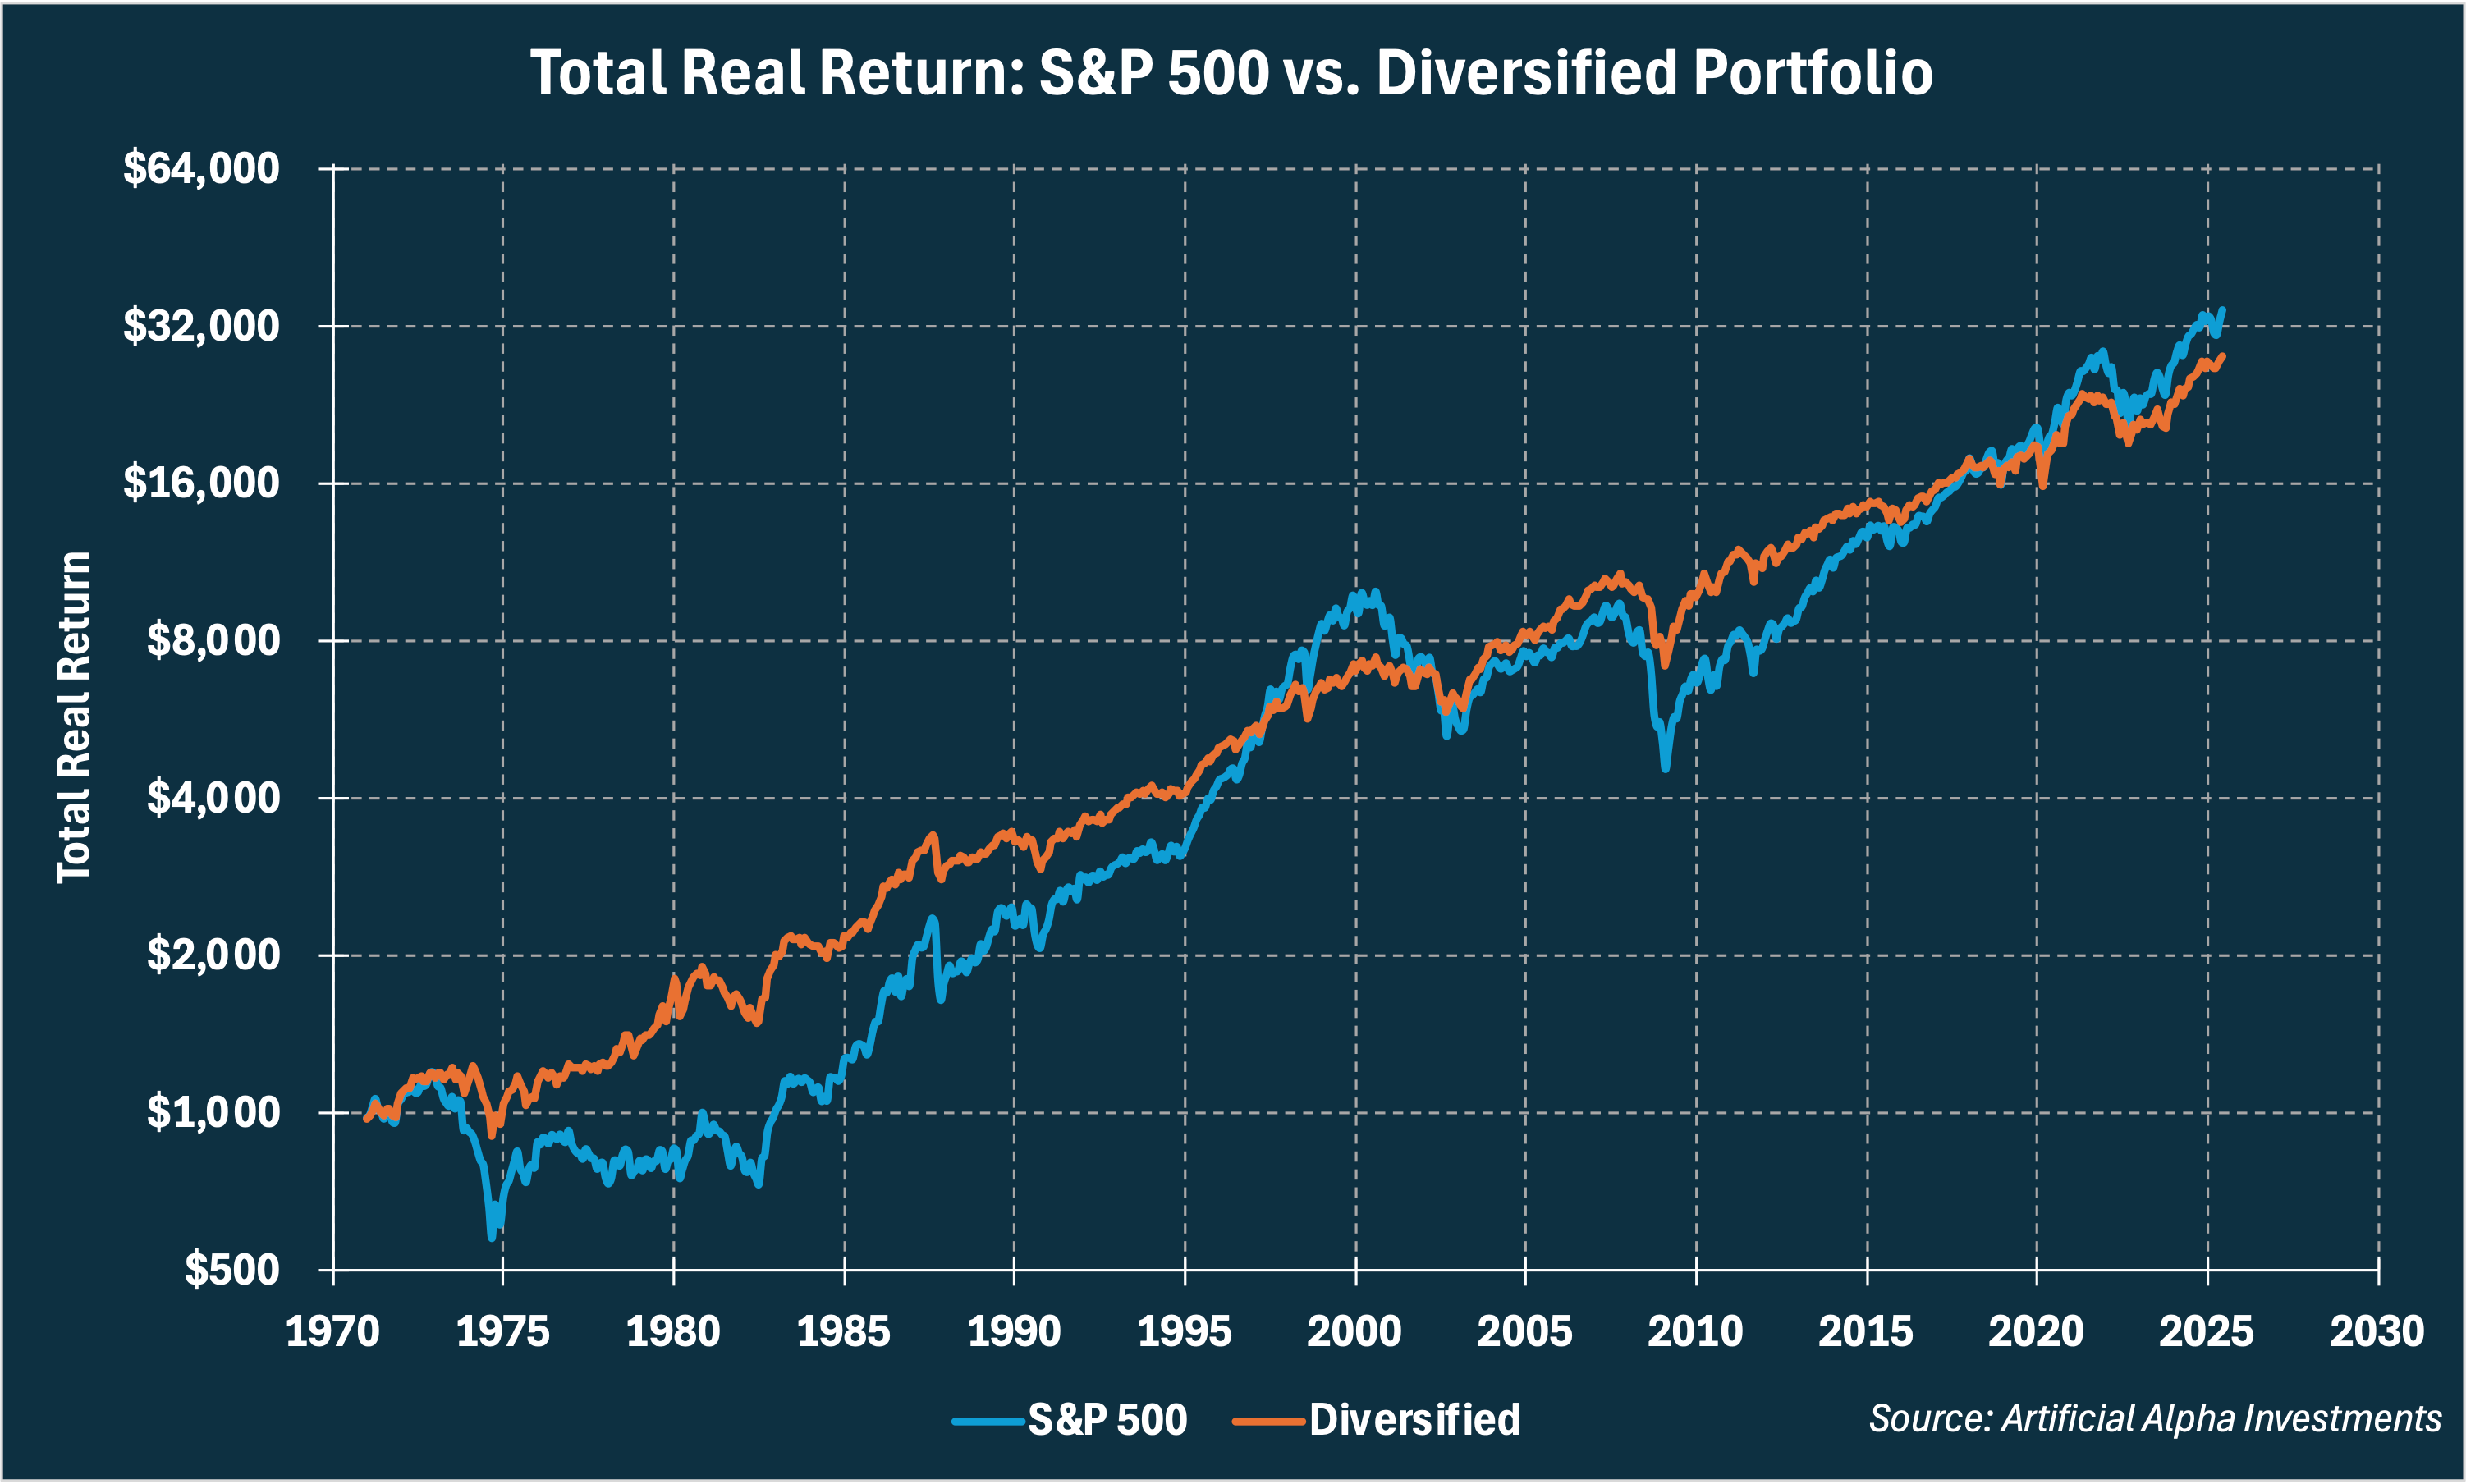
There is a small total return drag on the diversified portfolio, but it exhibits far less volatility than the S&P 500. I would like to note that the volatility reduction acts over both short and long time-frames. The diversified portfolio has smaller recessionary drawdowns and no lost decades in this sample.
Stretching Savings
One side effect of lower volatility is to support higher withdrawal rates and extended retirements. I previously introduced The 4% Rule because it provides a framework for testing these goals.
The chart below allows readers to observe combinations of withdrawal rates and retirement lengths that similarly resulted in a 1% failure rate. Four different portfolios are represented by the four curves.
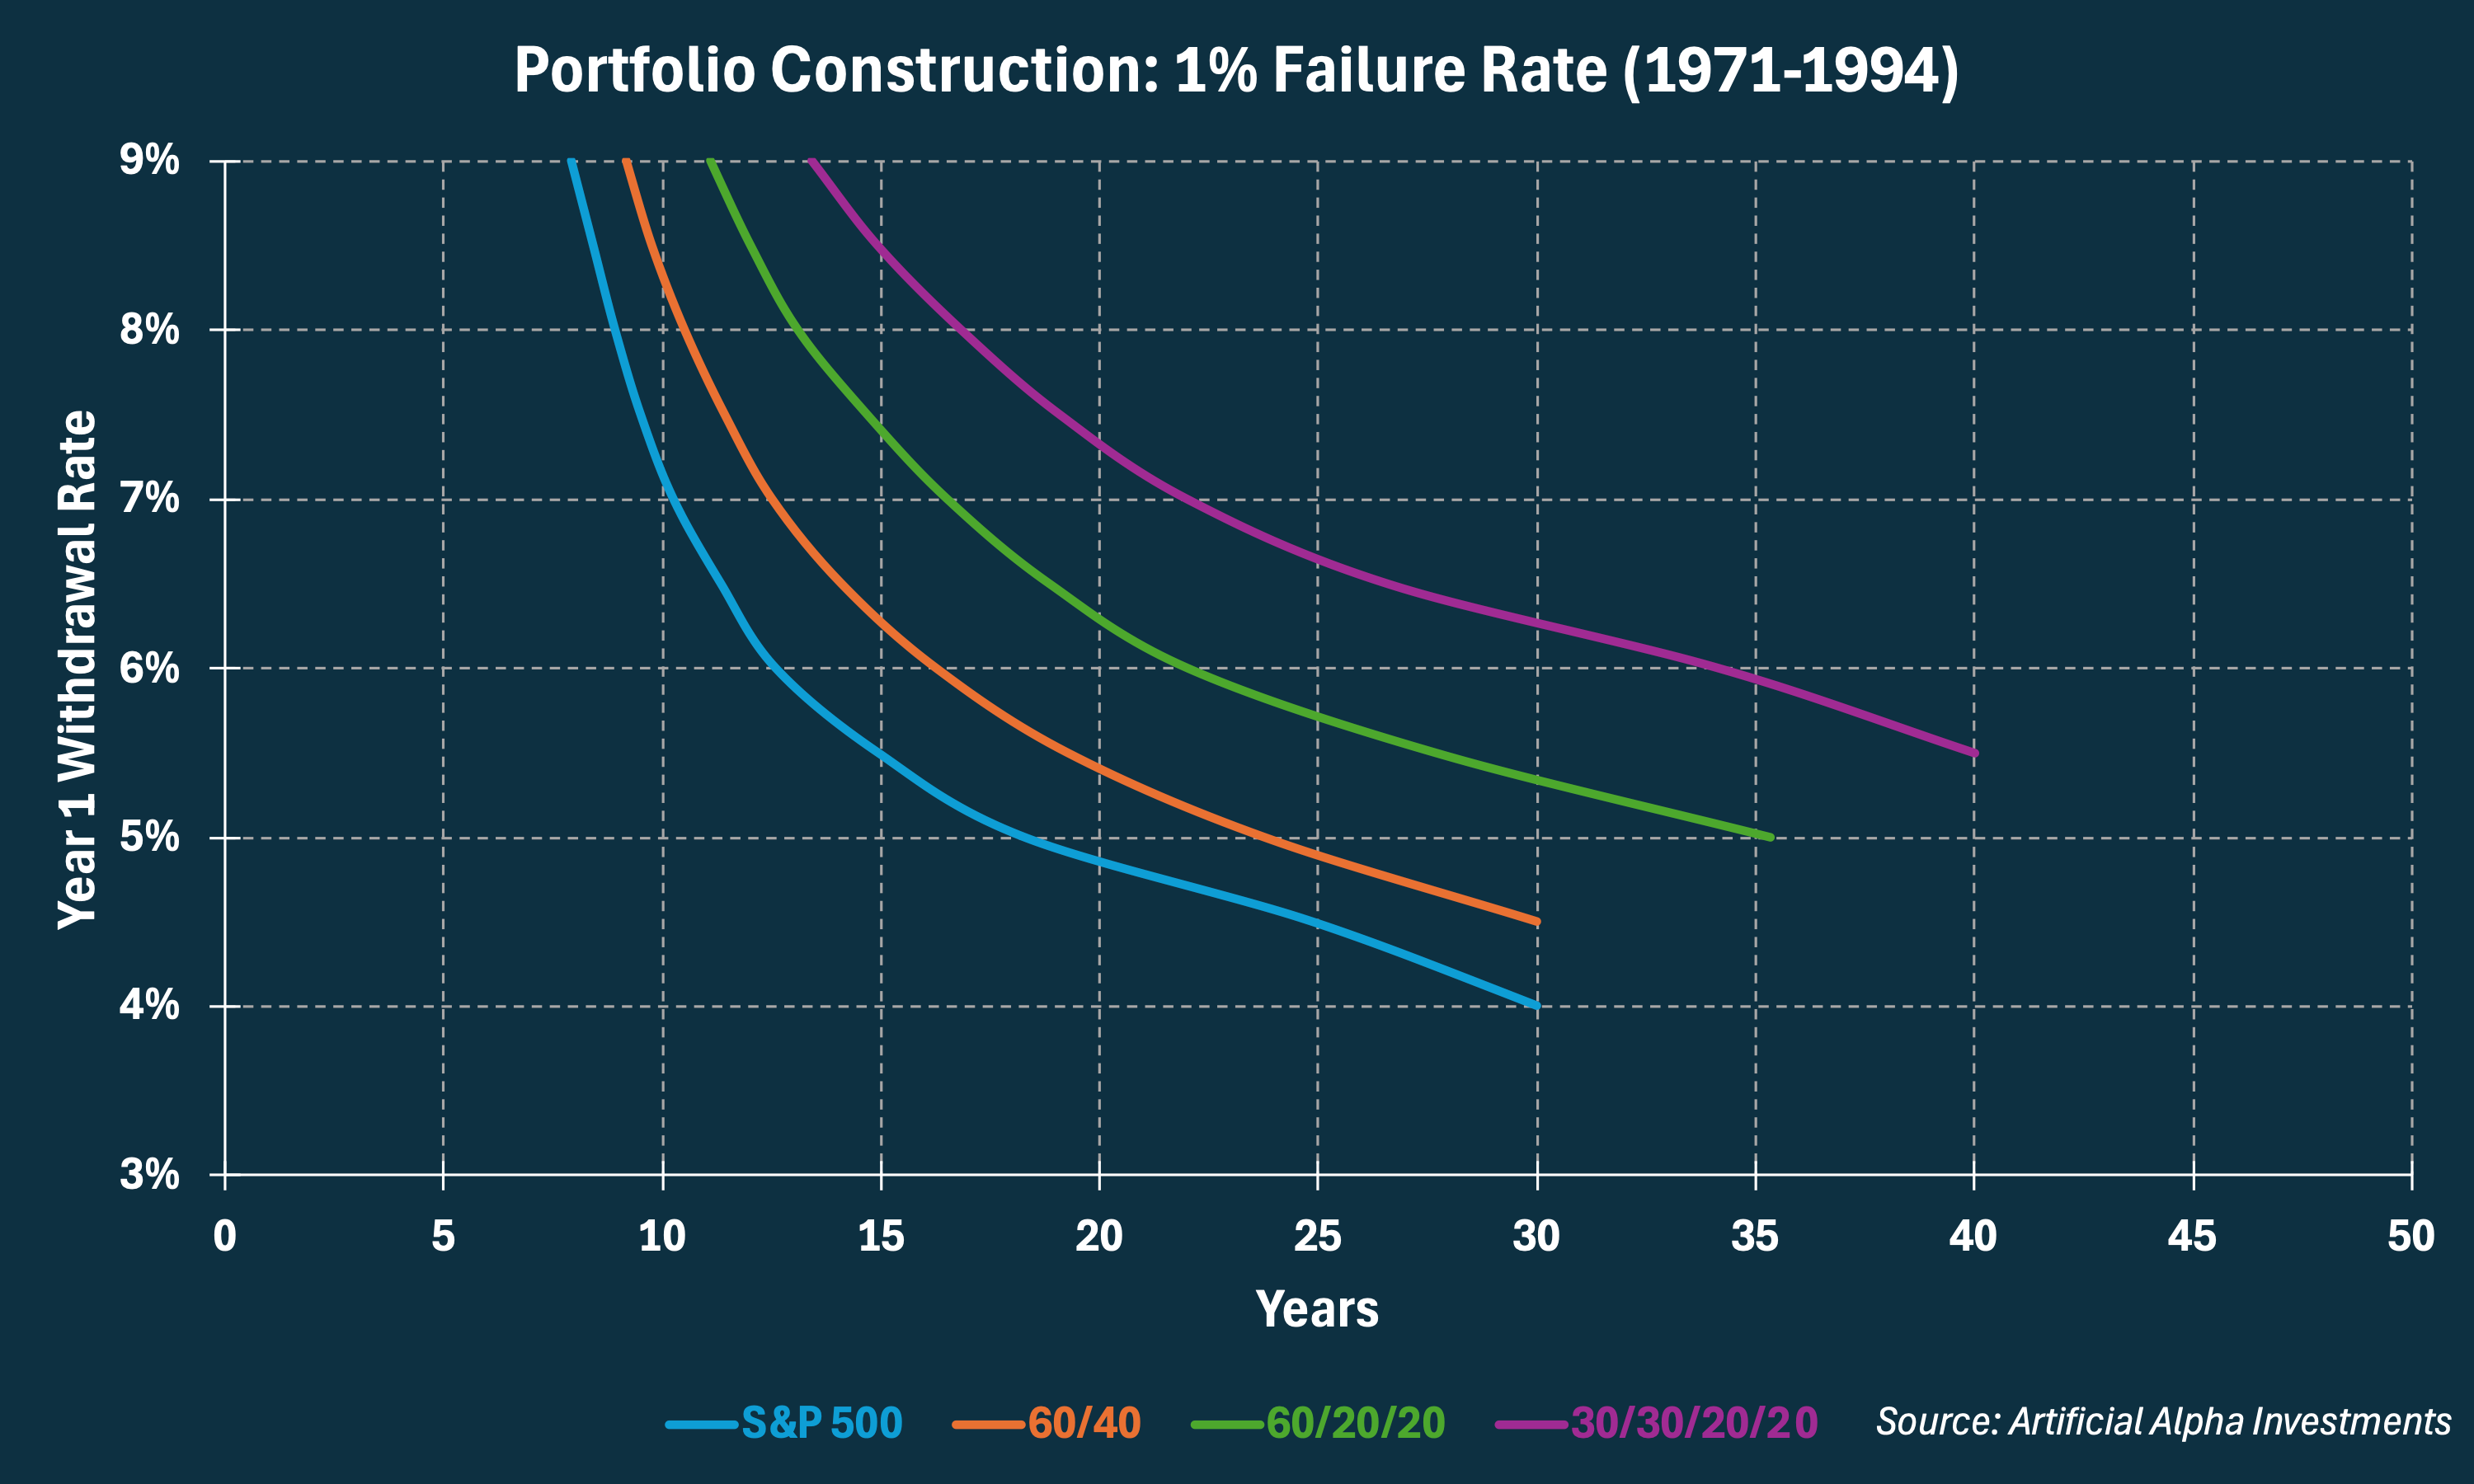
Investors could have increased withdrawal rates or extended retirements using each iteration of diversification.
Active Strategies
Buying an index of value and small stocks has passive value in a portfolio but active investors will find even more value in trading individual stocks in this space. This is the product that Artificial Alpha Investments uniquely offers clients. I will provide more information on this in a later letter!
Portfolio Construction
These findings use academic data to backtest results. In practice, we must find ETFs that deliver similar results.
One example of a portfolio that delivered similar results held 30% $VOO, 15% $VTV, 7.5% $VO, 7.5% $VB, 20% $SHY, and 20% $IAU.

In Summary
Now we have a completely passive portfolio that is reasonably diversified for investors with short/moderate time-frames, less risk appetite, and moderate/high withdrawal rates. This portfolio likely isn’t suitable for any individual, but I use it to illustrate the general goals of diversification as well as one possible conclusion.
Going Further
I develop quantitative models to service clients beyond these recommendations. These active products attempt to improve the performance of each sleeve in this portfolio. My next letter will summarize the product I provide suitable clients to outperform passive equity returns.
That was awesome! But why focus only on the value and size factors? The S&P 500 isn't purely large-cap growth—at least not historically