
Yield Curve (Un)Inversion

The yield curve finally uninverted this December after more than 2 years of inversion. A yield curve inversion is often referenced in bearish notes on stocks, but I think the relationship between the yield curve and equity investments is more nuanced than that.
The most cited yield curve plots Treasury yields on the y-axis vs. maturity dates on the x-axis. A normal yield curve is positively sloped, because bonds with longer maturities carry more risk (chief of which is inflationary risk) than a bond maturing tomorrow.
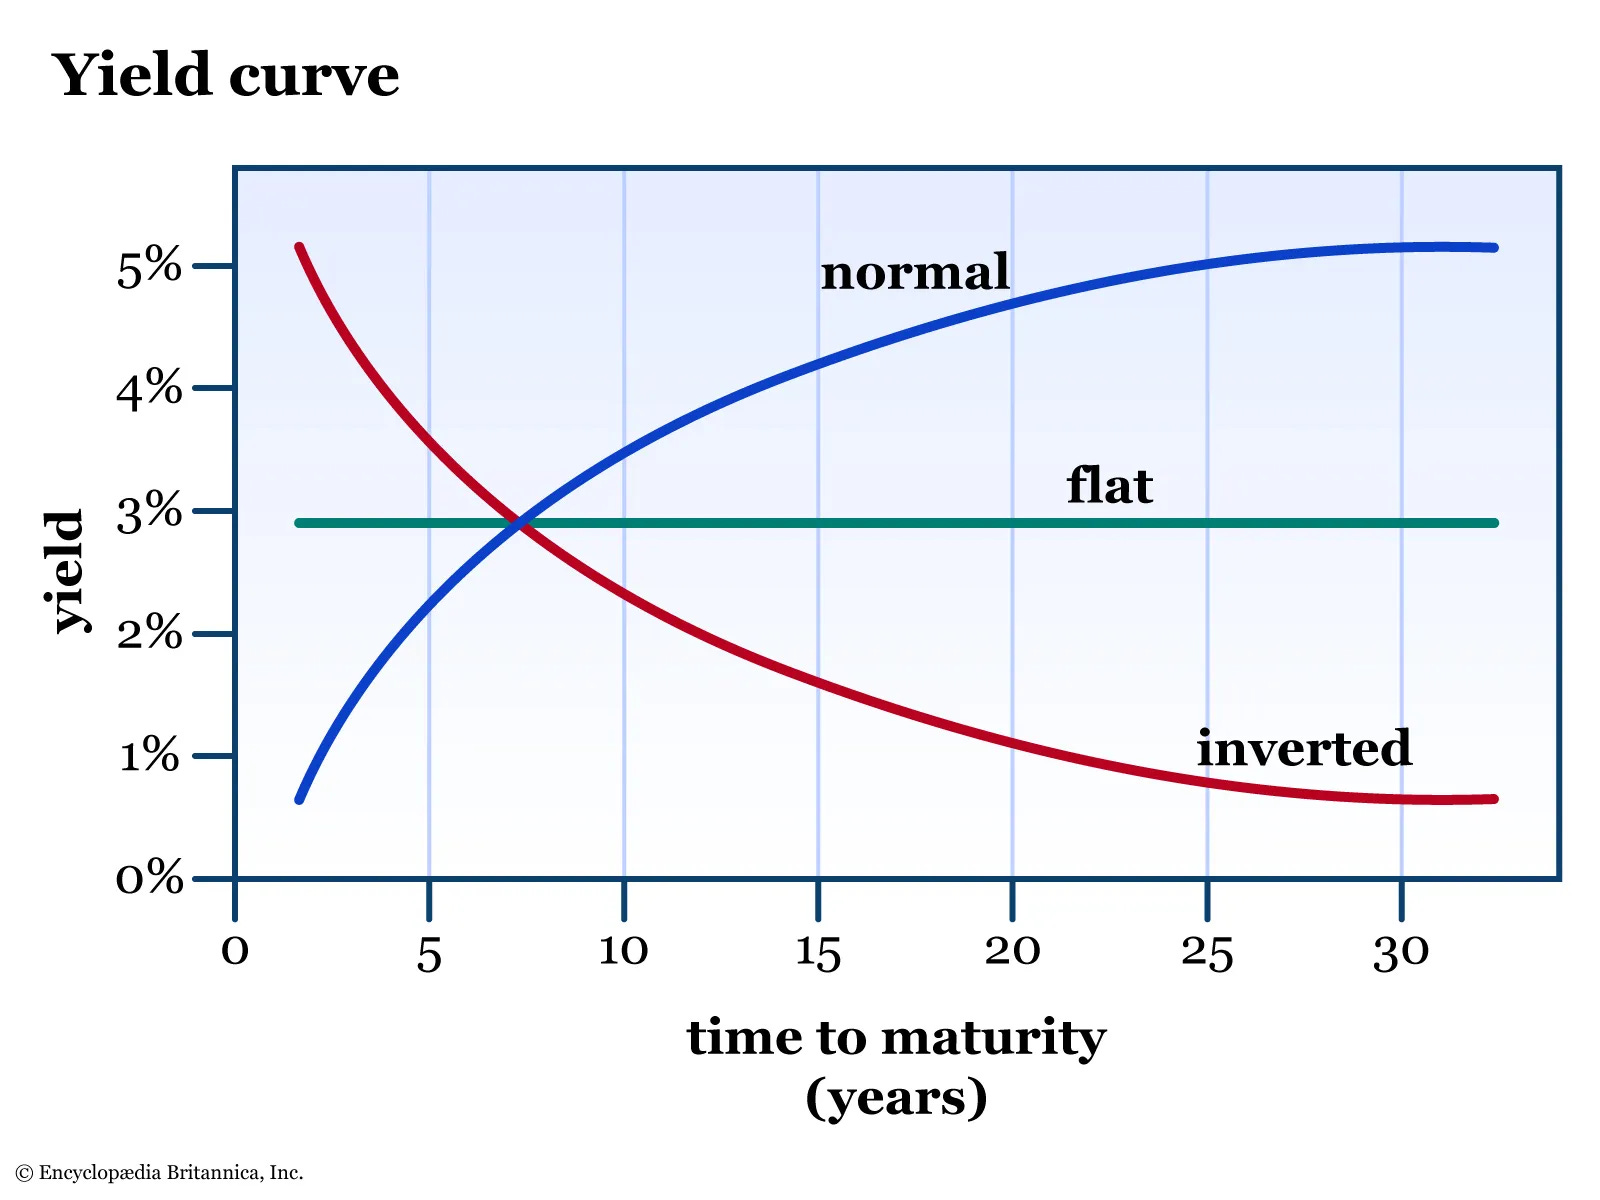
An inverted yield curve features higher yielding short-term bonds at present but expectations for lower short-term rates in the future. Normally, this type of pricing is due to expectations for a forthcoming recession, during which the Federal Reserve tends to dramatically lower short-term rates and make up for temporary money market outperformance.

Although yield curve inversions are almost always adjacent to recessions, they don’t necessarily represent a sell signal for the S&P 500. Remember my tongue-in-cheek mantra, “buy always, especially at the lows.”

Part of the reason this signal is so weak is because many companies, especially the large-cap companies in the S&P 500, borrow at long-term rates and are unaffected by the higher short-term rates of the inverted yield curve. Small-caps and mid-caps borrow at short-term rates more often and are disproportionally affected by an inverted yield curve.

An inverted yield curve is more indicative of a comparative advantage for large-caps than it is a sell signal for the entire market. In fact, the competitive relief of yield curve normalization is so great for small-caps and mid-caps that they have outperformed the S&P 500 by 13.5% and 21.4% on average in the year following uninversion.
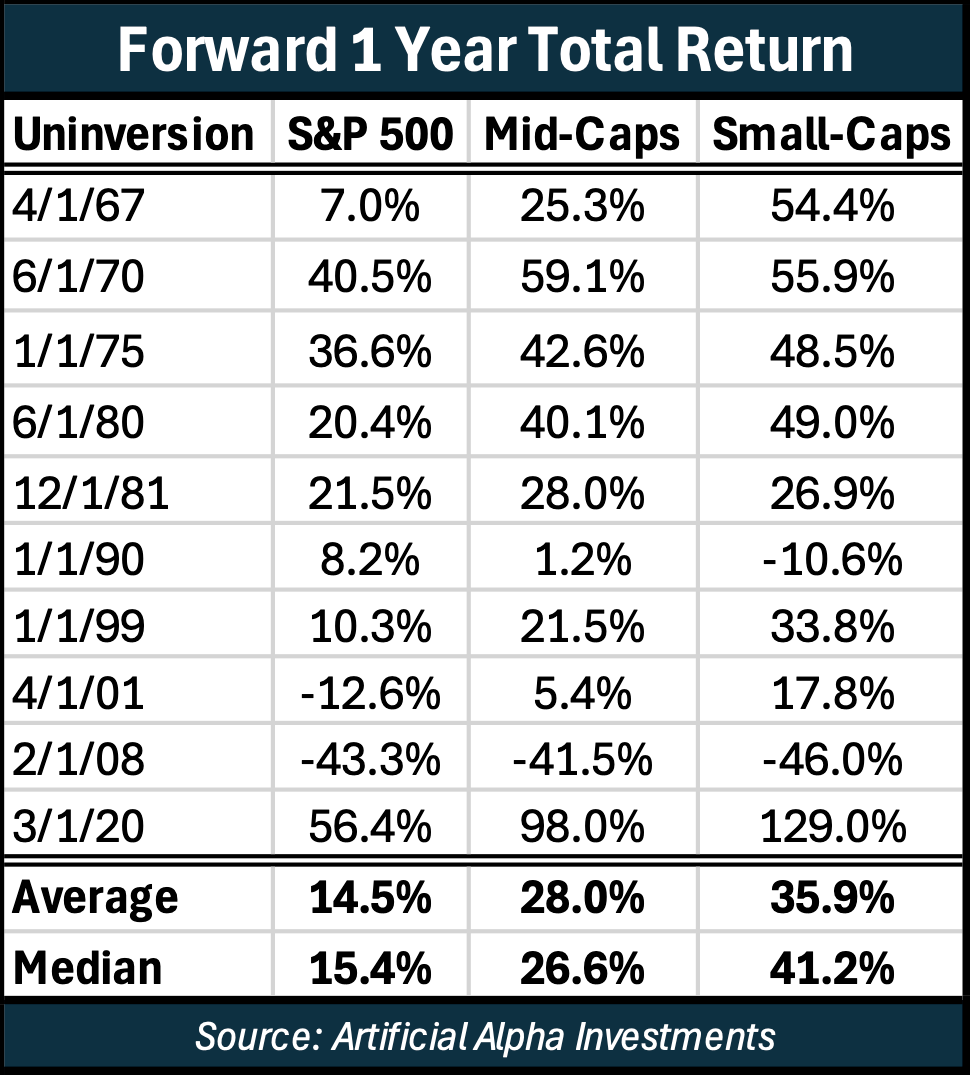
Overall, small-caps and mid-caps are hurt most by higher short-term rates and yield curve inversion. Afterwards, they enjoy tailwinds of normalization.

I almost added this letter to my Misleading Data series because of how much pessimism an inverted yield curve produces. This analysis makes it clear, however, that most investors, specifically those allocated to the S&P 500, are not heavily exposed to the most rate-sensitive investments.
I also considered making this a continuation of my Stock Market Concentration series because this December’s yield curve normalization might very well catalyze the opportunity outlined in those letters. I will continue to diversify away from the S&P 500’s high concentration and expensive multiples with additional confidence.
And I also questioned whether this letter should be released at all because many investors should ignore 1-year implications on principle. But I am slowly coming to understand that even long-term investors have entry points for investments they’ve deemed suitable for their goals. It is reassuring for buyers and holders to identify when a long-term, fundamentals-driven investment like this one might feel tailwinds.
Hopefully this letter will impress all these ideas. That the S&P 500 doing fine while small-caps and mid-caps underperform is par for the course during a yield curve inversion. That I suspect active investors could finally see tailwinds in 2025 for beaten down small-caps and mid-caps. And that this 1-year analysis is aligned with a larger, long-term investment thesis as opposed to standing on its own as a trade.