
Misleading Data (Earnings)
Originally published on 11/7/2022

I risk sounding repetitive, but I want to provide another example of a misleading dataset that threatens to derail any investor’s strategy. This time we will explore the Shiller P/E ratio through the same lens of data quality that we used last month.
The best financial data are descriptive of a prevalent investment concept and predictive of a key performance indicator. Misleading data tend to fall well short of one or both requirements, which leads to a distorted understanding of the present and/or an inaccurate portrayal of the future.
The S&P 500 Shiller P/E is a ratio between the current price of the S&P 500 and its 10-year average inflation adjusted earnings. A long-term chart of the S&P 500 Shiller P/E might convince investors that the S&P 500 has never been more expensive relative to its earnings.

The rising S&P 500 Shiller P/E is not concerning to me, however, in part because S&P 500 earnings data fall short of my descriptive test. S&P 500 earnings data do in fact measure the income of S&P 500 companies over time, but accounting standards have changed so much that today’s earnings calculations do not resemble those of the 1970’s. I am not a GAAP accounting expert so here are some articles attempting to tackle the subject [1] [2]. My estimate is that companies began using a substantially different earnings calculation in the late 1980’s and any post-1990 S&P 500 Shiller P/E data cannot be compared to any pre-1990 S&P 500 Shiller P/E data.
S&P 500 Shiller P/E data are also not predictive and fail my second test of good financial data. The S&P 500 Shiller P/E was once predictive of future 10-year total returns for the S&P 500 but, with the aforementioned changes to earnings calculations, its signal fell apart during the late 1980’s. S&P 500 Shiller P/E data now paint a gloomy but inaccurate picture of future 10-year total returns for the S&P 500.

There is no perfect replacement for S&P 500 earnings since, as far as I know, there is no way to reconstruct S&P 500 earnings data using consistent accounting practices. We could substitute S&P 500 earnings for Corporate Profits After Tax from the U.S. Bureau of Economic Analysis to combat measurement inconsistencies, but these data measure corporate profits for all U.S. corporations. This is not a perfect solution because U.S. corporate profits will not always resemble those of the S&P 500 subset.
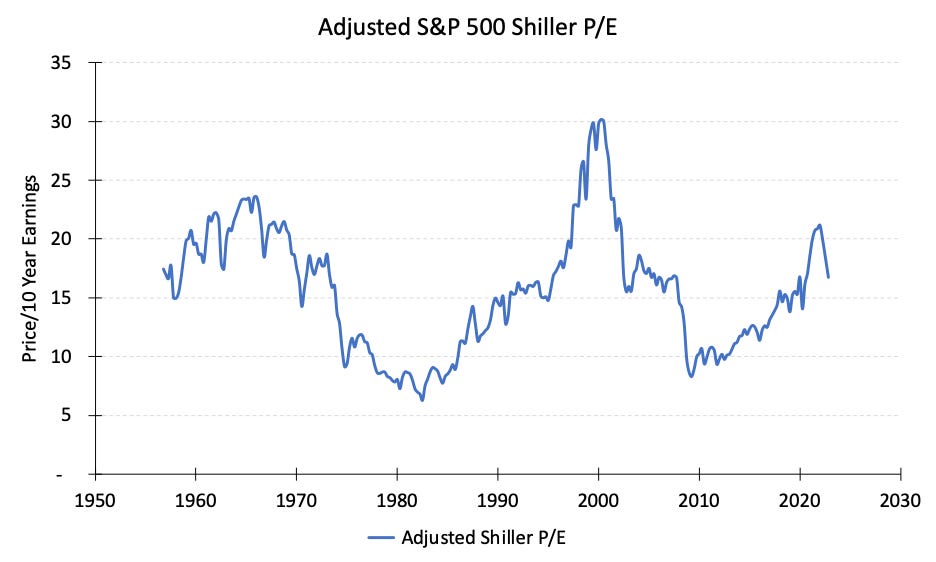
Using these national corporate profits data yields an adjusted S&P 500 Shiller P/E ratio that is far more predictive of future 10-year total returns for the S&P 500.

Again, the purpose of this letter is not to find the best money-making S&P 500 P/E metric. In fact, I don’t suspect this new metric will maintain its predictive value since it still uses earnings data that are not perfectly descriptive of S&P 500 earnings. Instead, I want to highlight how misleading S&P 500 Shiller P/E might be to a buy-and-hold investor who is easily spooked by scary looking data. We can throw S&P 500 Shiller P/E into the pile of misleading metrics that should not cast doubt on an investor’s current strategy.